What is spatial data?
Geospatial data contains information about a physical object that has a size, shape and location on Earth and is represented in a geographic coordinate system.
The Earth and the objects on and below its surface have been mapped for millennia. The most rudimentary would be identifying a landmark that others could easily find and use as navigation. Maps became increasingly complex and detailed to be used for navigation, military defence and dividing the world into countries, districts, counties and other administrative jurisdictions.
Examples of spatial data
Spatial data is information about where observations are in relation to each other. Usually, this means that one of the dimensions associated with each observation describes that record's position in space.
So, if we look at this dataset:
| id | name | age (years) | favorite_color | has_smartphone | coordinates [lon, lat] | city |
| 0 | "Helena Espinosa" | 29 | "blue" | true | [-5.930, 54.596] | Belfast |
| 1 | "Dorian Beach" | 17 | "green" | false | [3.189, 55.953] | Edinburgh |
| 2 | "Lukas Craft" | 44 | "purple" | false | [-3.183, 51.483] | Cardiff |
| 3 | "Vishal Needham" | 83 | "grey" | true | [-0.128, 51.507] | London |
By including the geographic coordinates in the dataset, it becomes spatial data. With this additional dimension, much deeper insights about the records in a dataset - and their relationships - can often be drawn. In fact, often the spatial dimension is the key to understanding relationships and answering questions an analyst might want to understand.
Raster and Vector
Spatial data typically falls into two categories: raster and vector. Both are ways to describe space and represent features, but they work quite differently.
Raster Data
A raster is a “grid of regularly sized pixels”. By assigning each cell in the grid a value — or a few values — images can be described numerically, as multidimensional arrays.
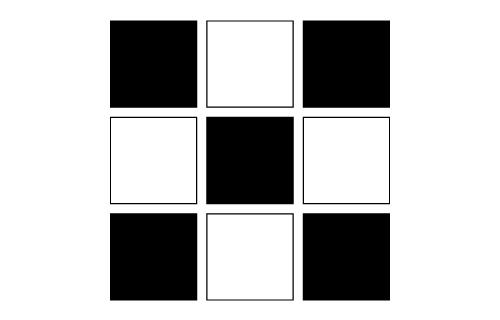
For example, take a 3x3 grid that looked like this image to the left.
If 1 means black and 0 means white, we could represent it numerically like this:
img = [[ 1, 0, 1 ],
[ 0, 1, 0 ],
[ 1, 0, 1 ]]
The numbers in raster cells can mean lots of things — the altitude of the land or depth of the sea at that specific point, the amount of ice or snow on that point, the number of people living within that pixel, and so on. Further, just about any colour in the visible spectrum can be described by a combination of three numbers representing the intensity of Red, Green and Blue (RGB) — satellite images are raster data structures. GeoTiff, jpg, png and bitmap files contain raster data.

Vector Data
Vector data is a bit more abstract. In a vector dataset, features are individual units in the dataset, and each feature typically represents a point, line or polygon. These features are represented mathematically, usually by numbers that signify either the coordinates of the point, or the vertices (corners) of the geometry.
Points, Lines, Polygons
As a quick example, here’s a bare-bones numerical representation of each of these types of features:
point = [ 45.841616, 6.212074 ]
line = [[ -0.131838, 51.52241 ],
[ -3.142085, 51.50190 ],
[ -3.175046, 55.96150 ]]
polygon = [[[ -43.06640, 17.47643 ],
[ -46.40625, 10.83330 ],
[ -37.26562, 11.52308 ],
[ -43.06640, 17.47643 ]]]
// ^^ The first and last coordinate are the same
Vector features will often have some metadata included that describes the feature — the name of a road, say, or the population of a state. These extra, non-spatial dimensions to an observation are usually called “attributes”, and are often represented in an “attribute table”. Very often spatial data scientists will combine the spatial dimensions (coordinates — for points, or coordinate arrays — for lines and polygons) with non-spatial dimensions in their analysis. GeoJSON and .shp files commonly contain vector data.
Why is spatial special?
In the spatial data community you'll often hear the phrase "spatial is special". Why is this?
Very often - in the physical world, at least - location matters. Events near one another tend to be more correlated that with distant ones, a phenomenon captured in Waldo Tobler's First Law of Geography: "Everything is related to everything else, but near things are more related than distant things."
Because of this 'spatial autocorrelation', special statistical techniques are required to draw meaningful insights out of spatial datasets.
With spatial data, along with a range of statistical and visualisation techniques, analysts, data scientists and developers can learn more about the world.
Choose the data that's right for you
Use OS data products in your Geographic Information System (GIS) to view and analyse map data. Our open data and premium data works in a range of mapping software including ESRI ArcGIS, QGIS, Mapbox, Cadcorp SIS, MapInfo, Tableau, Kepler.gl and many more.

Our highly accurate geospatial data and printed maps help individuals, governments and companies to understand the world, both in Britain and overseas.